This article first appeared in the Summer 2022 (issue 5) of The Distillers Journal
The ethanol used to make white spirits like gin, vodka and also RTDs, has some quirky behaviours and there is one in particular that some may not be aware of, one that has confounded distillers and can affect production if not taken into consideration. On several occasions, during the blending process, distillers have been puzzled by the mysterious case of disappearing ethanol. A disappearance that isn’t caused by spilt product or thievery, and while it might make for a more dramatic reading to suggest that the industry has its own version of the mysterious Bermuda Triangle, the answer is more logical and is found in physics.
Like many laws in physics, they apply to our environment all the time, but many effects might go unnoticed at a low scale, speed, short distances and in our case: small volumes. However, once the scale increases, the detail of physics can no longer be ignored and the answer that one might expect may not be in line with our expectations.
Here is a prime example: one day at our Ethimex warehouse, when reducing 17,000L of ethanol from 96% ABV to 40% ABV with demineralised water, about 350L in volume went missing. This was without any spillage or evaporation. Logically, one will expect that if you add 1L of water to 1L of ethanol you would end up with 2L of liquid, however, if measured accurately the resulting mixture will be less than the expected 2L. What takes place is known as shrinkage.
Water and ethanol like each other very much and form bonds – hydrogen bonds. This is not a chemical process; it is a physical process. Ethanol (C2H5OH) has an -OH group called a hydroxyl group, which allows a molecule of ethanol to form a hydrogen bond (H-bond) with water. This bond is one of the strongest intermolecular forces however, this causes the density to increase and the volume decreases, which is why we get shrinkage.
Thankfully, one of the great advantages is that water and ethanol dissolve in each other perfectly, which is great when making spirits at different alcohol ratios or ABV. On the flip side, water and ethanol also form a positive azeotrope (also known as a constant boiling mixture) at 95.63% ethanol and 4.37% water (by mass). Ethanol boils at 78.4 °C and water boils at 100 °C, but the azeotrope mixture boils at 78.2 °C, which is lower than either of its components. After fermentation, the last percentage of water cannot be extracted from the ethanol by simple distillation, it would require a third agent or the use of molecular sieves to achieve this. Ethanol at 99.9% is known as anhydrous ethanol or absolute ethanol. It is most hygroscopic and it must be stored and handled carefully, or it will absorb water vapour from the air until it reaches the 95.6% azeotropic concentration. This type of ethanol is mainly used for pharmaceutical, cosmetic, and industrial applications but is now also available for beverage development.
Shrinkage is most prominent between 20% and 70% ABV which is precisely where distillers like to position their liqueurs and spirits. However, as the graph below shows, the amount of shrinkage varies with ABV and is not linear as one might expect, and the highest percentage of shrinkage value occurs at about 50% ABV with an increase of density of 2.2%.
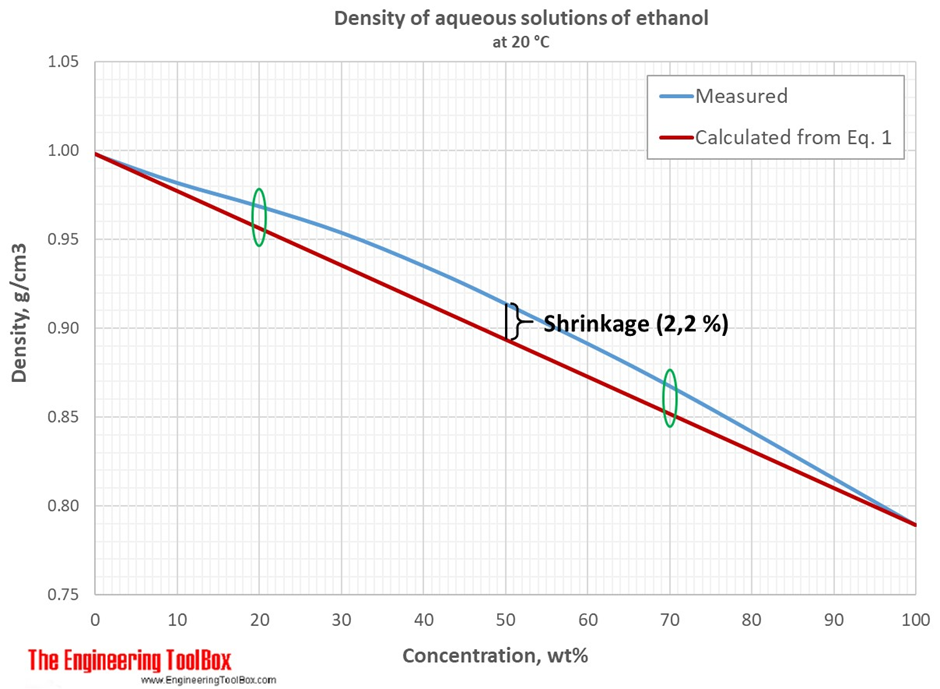
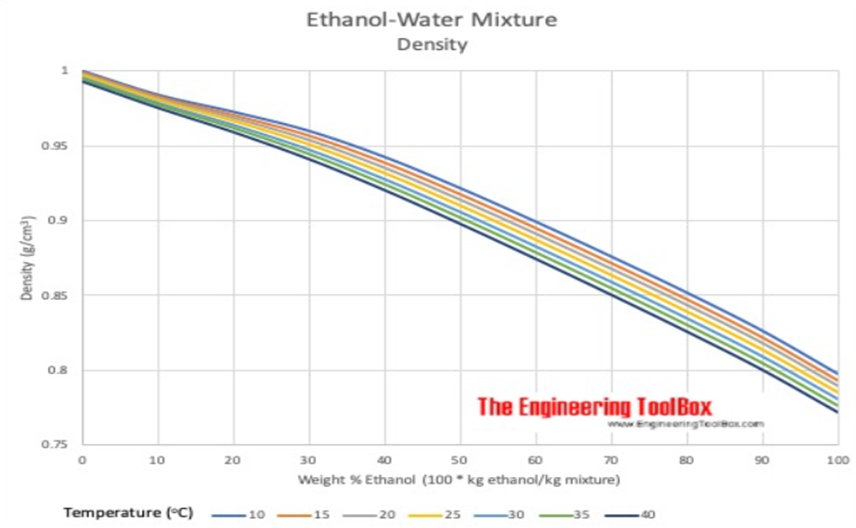
If we put the science of bonding to the side for one moment, the effect of shrinkage could be compared to adding half a bucket of water to half a bucket of sand, the result is more than half a bucket but not quite a full one. However, the weight of the sand-water mixture will be exactly that of the weight of the sand plus that of the water. The same is true for the ethanol-water blend, so when working in mass there is no discrepancy. This makes sense under the Law of Conservation of Mass. However, historically distillers prefer to work in volume and ABV (or proof) but because there is no Law of Conservation of Volume, the relationship between density, temperature and ABV must be considered carefully when handling alcohol. Notice that the first graph illustrates the density curve at 20°C. The second graph illustrates that each temperature has its own graph with a more pronounced shrinkage at lower temperatures.
Another ethanol disappearing trick of a different kind demonstrates the importance of this triangular relationship. This time it is the physical shrinkage under influence of a change of temperature. An obvious occurrence but again not really noticeable for small volumes. Here’s a real-life example that illustrates what can happen if this is ignored: a tank truck of ethanol was shipped from the south of France to the UK, when unloading the receptor noticed that a significant volume of ethanol was missing even though the paperwork was crystal clear about the loaded volume. The tank truck remained sealed throughout the whole journey so there was no possibility of tampering. What happened here is that the truck was loaded at 19⁰C, travelled to Calais, waited overnight at the harbour and was delivered early the following morning at 7⁰C.
What the receiver did not consider is that the volume is irrelevant if it is disconnected from the temperature. Like many substances, alcohol expands and shrinks with temperature variation. So, what was the right way to verify the load of ethanol? For any calculation, whether for blending, invoicing or taxation, ethanol is always considered in its state at 20⁰ C. If the actual alcohol is not at this temperature, a temperature correction factor is applied. Most commonly a load of ethanol will be expressed in LPA (Litres of Pure Alcohol) at 20⁰C. Consider that a standard IBC with a physical volume of 1000L of ethanol will contain more LPA in the winter than in the summer. Regardless of this actual volume, all documentation will show the volume of LPA adjusted to 20⁰C.
As you might have guessed, there is no linear relation between density and temperature and ABV, you would need a three-dimensional graph to have an accurate view. Instead, there are the Practical Alcohol Tables published by the EU in 1978 or if you want a shortcut, you could use a manual or electronic alcohol meter. One thing is for sure, measuring the alcohol level by tasting will not work!
It is important to recognise the occurrence of shrinkage and appreciate the concept of LPA as it will help with calculations for reducing high-strength alcohol, and correct duty calculations especially when blending several spirits at different ABVs. This is where working with the right partners can be quite important. As a supplier of ethanol and bulk spirits, and with two decades working in the global ethanol trade, we are extremely well versed and familiar with the intricacies of alcohol tables and LPA conversions and use our expertise to make sure our customers get exactly what they desire. Contact us today for more information.
Fill out the form below to subscribe to our mailing list and download our fact sheet